Plots of the data of the SoCG-ACM voting
Jeff Erickson organized the recent vote for the computational geometry community to decide whether the Symposium on Computational Geometry (SoCG) should stay with ACM or whether it should be organized independently. In addition to asking whether to stay with or leave ACM, he also asked whether one is willing to help organizing SoCG. A few days ago, he presented interesting numerical data of this vote, grouped by country and affiliation of the voters. In the following we present plots from this data.
For an interpretation of the data, I refer to Jeff Erickson’s article.
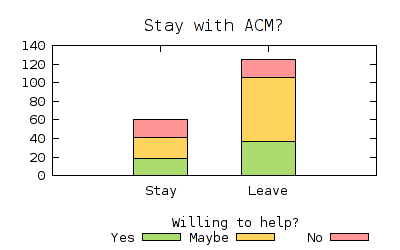
The central question
The plot below shows the number of votes for staying with and leaving ACM, grouped by the willingness to help to organize SoCG.
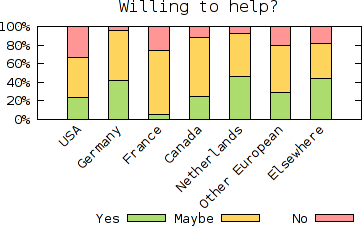
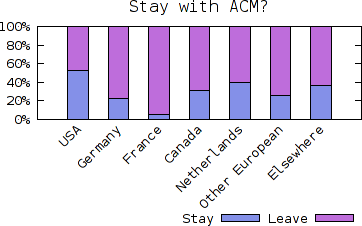
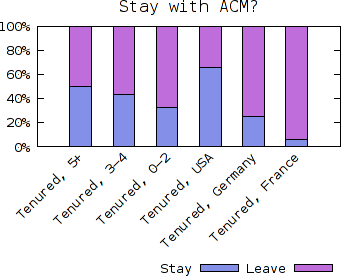
Grouped by country
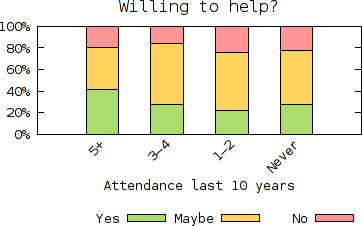
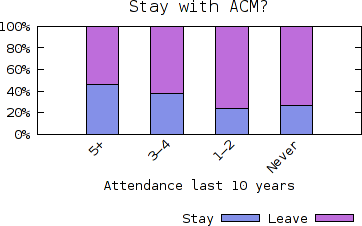
Grouped by attendance
The plot below shows on the x-axis the number of times a person attended SoCG in the last 10 years.
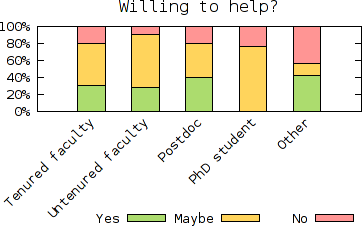
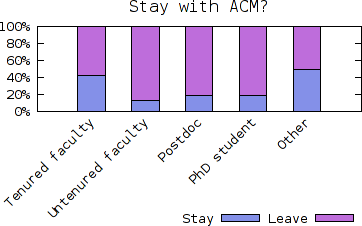
Grouped by affiliation
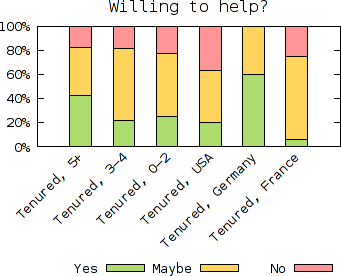
Grouped by attendance and country within tenured
Data
I put the data and the gnuplot script into the directory data/ on this site. Feel free to download and modify.