pygdb
A pygtk interface for gdb in connection with (g)vim
Story
I was searching for a debugger integration of gdb into vim and found the following solutions:
-
There is Clewn/vimGdb which interacts with vim using the netbeans interface. However it requires to patch the vim sources.
-
vdb is a vim script which tries to emulate a terminal in a vim buffer. The approach has several advantages: You can debug a program via a remote session a la ssh and you do not have to leave vim at all. However, the author seems to investigate into some communication issues with gdb.
Moreover, the author pursues a very generic approach to support multiple debuggers by specifying a “command interface” to the debugger. Currently, support for pdb has been added.
-
Finally, there are further gdb integrations, like gdbvim, VimDebug, or gdvim.tar.gz. Unfortunately, most of them seem to be staled projects.
I was inspired by vdb in the following sense: they use python as scripting language in vim and implement a gdb interface inside vim. I liked this idea and started to implement a popen-based gdb interface for myself. Later I found out that vte fits exactly my needs: it implements a Terminal where gdb can run inside. Moreover, the inferior process of gdb (the process to be debugged) can be moved to a pty (by the inferior-tty command) and on the other hand, vte.Terminal can communicate with processes by setting the corresponding pty.
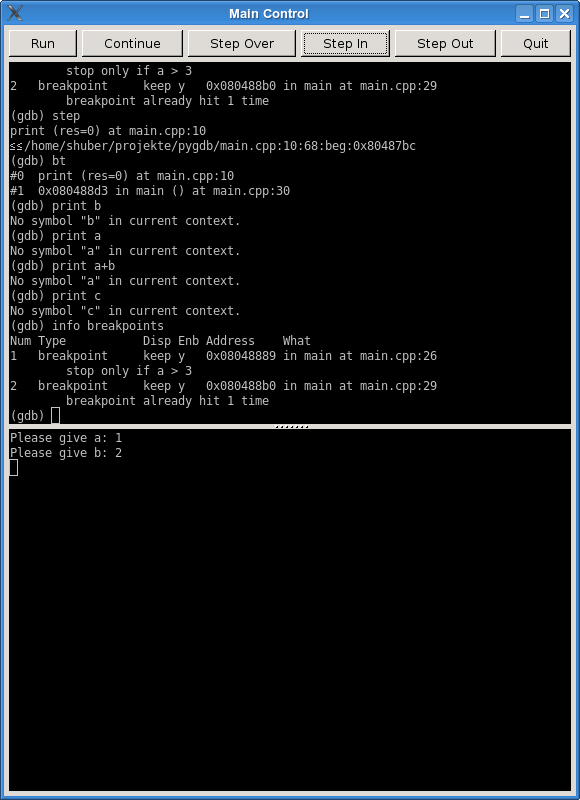
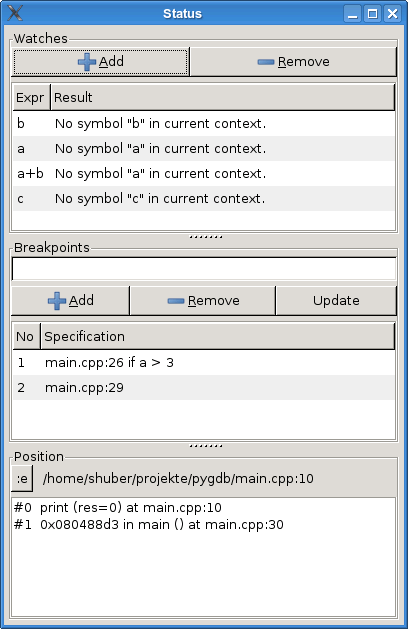
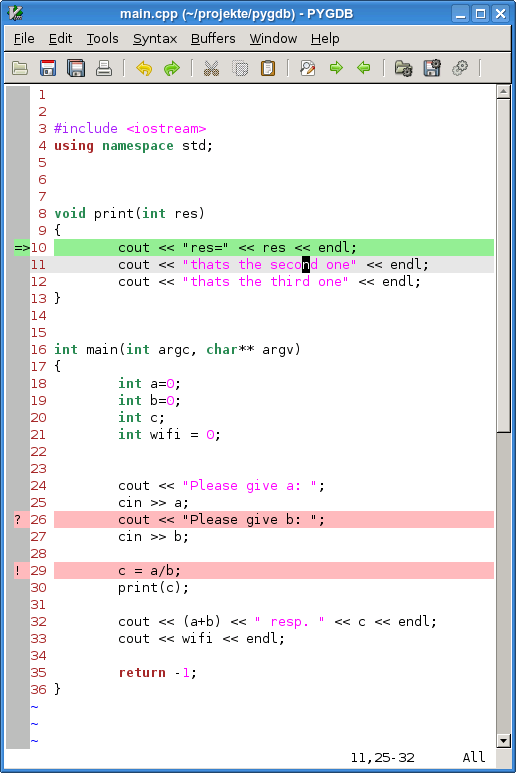
To sum up, after programming a week or two (of course not full time), the first prototype was ready for usage (v.99.0). That includes: a pygtk interface to gdb with a gui interface to add watches, breakpoints, view the backtrace and load vim at the current execution line. Moreover, vim keeps to be updated whenever gdb catches a breakpoint. On the other hand, breakpoints can be set in vim and pygdb can be launched inside from vim.
Screenshots
Code
As already mentioned, the code is almost completely written in python. Of course, a very little part uses some basic vim script to map the python functions. You may want to checkout the corresponding git repository or download a tar.gz snapshot from git.sthu.org.
Installation, Usage, Features
The git repository contains a INSTALL.txt which explains the installation. As a summary, you have to set the PATH variable accordingly to enable you to call pygdb.py from a terminal. Furthermore, you have to put initializing code into your .vimrc.
Once pygdb is set up properly you can launch vim with a C or a C++ file and press F8 resp. Shift-F8 to set breakpoints resp. conditional breakpoints. When running pygdb a configuration file .pygdb.conf is saved in the current directory, every time the state changes. This file includes watches, breakpoints, widget geometry and similar things. By pressing Shift-F9 in vim, this file is loaded and breakpoints are updated in vim. Pressing F9 displays the breakpoints set in vim.
When pygdb detects that a breakpoint is caught a new configuration file is written and vim is told to reload the configuration. This works via the gvim –servername XXX –remote-send command.
The pygdb code detects caught breakpoints and other status changes by parsing the output of the debugger terminal. Therefore, it is possible to operate by setting up commands in the terminal directly and the gui should not get de-synchronized.
Additional Notes
-
This project is at its very beginning state. Chances are high that it will not be maintained in the future. For any epsilon greater than zero there exists a time t such that if you search for a bug for the time t you find a bug with probability 1-epsilon. In this project the t’s are very low in relation to its epsilons…
-
There is another project called pygdb. It is a python wrapper for gdb.